
Fundamentals Series: Asset Allocation – “History Tells Us to…”
Previously in the Fundamentals Series, we discussed how investors should implement the use of diversification into their investment portfolios rather than attempting to decipher the “winner” funds from the “loser” funds. There is little predictability in asset class performance from one year to the next, strengthening the case for broad diversification across many asset classes. Taking what we know about diversification and putting it to use in your portfolios brings us to today’s topic: asset allocation.
How a portfolio is structured, or the breakdown of stocks, bonds, and cash, is defined as the portfolio’s asset allocation. Investors chose an asset allocation that reflects their financial goals, investment time horizon, and risk preferences. Although there is no "perfect" portfolio, many investors will find that a sensible approach incorporates diversification across multiple sources of risk and return. The graphic below illustrates how various model portfolios along the risk/return spectrum might be constructed to capture the size, geographical, and value risk premiums in global markets. To simplify the illustration, the proportion of stocks and bonds remains fixed at 60/40. The changes across the model portfolios involve diversifying the allocation across a greater number of equity asset classes.
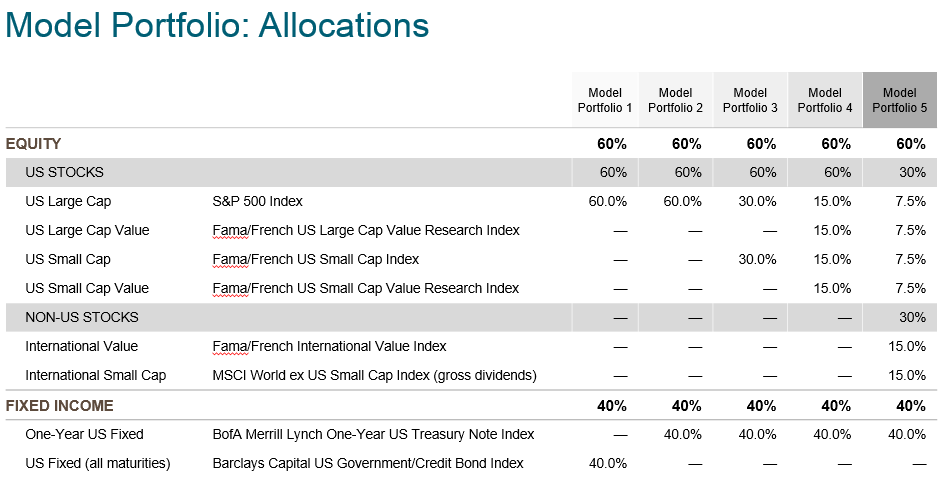
As you can see, equity is broken down into large and small, large cap value and small cap value, and lastly into an international small and value element.
Let’s take a look back to see how these portfolios would have performed over the last fifteen years.
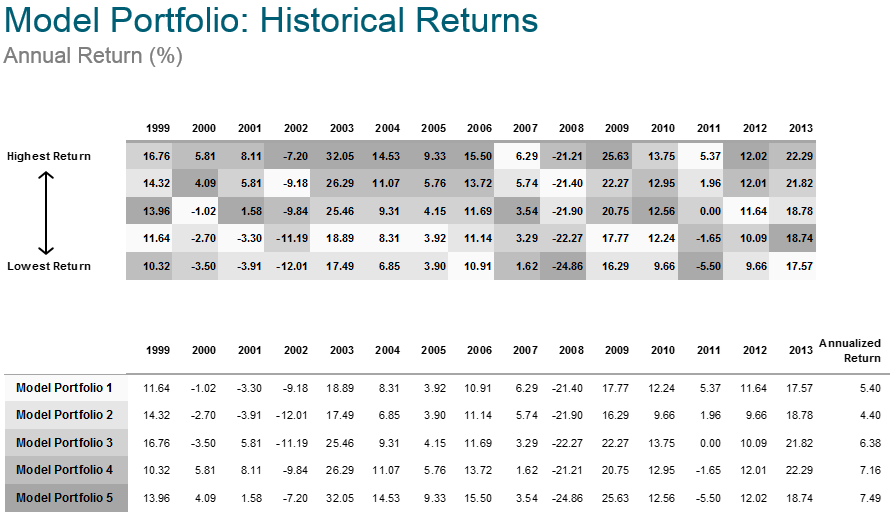
The upper chart ranks the year-to-year returns (from highest to lowest) of the model portfolios using the corresponding colors.
The lower chart features historical annual performance of the model portfolios over a fifteen-year period, with the far right columns showing annualized returns for the entire period.
The dispersion of colors now appears mostly uniform and consistent, with the more diversified model portfolios prevailing in the majority of one-year time periods. This example illustrates how markets tend to reward investors for the risks they bear, with riskier strategies generally offering higher expected returns.
Model Portfolio 5, a fully diversified portfolio, is the clear winner recording the highest annualized return. Still have your doubts?
To reiterate, asset class returns vary considerably from year to year, and past returns offer little insight into future performance. However, combining multiple asset classes (diversifying) tends to minimize the volatility associated with this random behavior. Global diversification reduces the effect of a single asset class or market. Remember what happened to the S&P 500 in 2008? Although many investors prefer to keep their capital close to home, they may pay a high price in terms of lower diversification and missed opportunity.
Next time, we take a closer look at various investment risk premiums that investors can claim and why we structure portfolios the way we do.
Written by Roddy Warren
Issued December 3, 2014
***Note: Graphics shown above are for illustrative purposes only. Model performance is hypothetical and should not be viewed as investment advice. Assumes all strategies have been rebalanced quarterly. The S&P data are provided by Standard & Poor’s Index Services Group. Fama/French data provided by Fama/French. MSCI data copyright MSCI 2014, all rights reserved; see MSCI disclosure page for additional information. The Merrill Lynch indices are used with permission; copyright 2014 Merrill Lynch, Pierce, Fenner & Smith Incorporated; all rights reserved. Barclays indices copyright Barclays 2014. The returns and other characteristics of the allocation mixes contained in this presentation are based on model/back-tested simulations to demonstrate broad economic principles. They were achieved with the benefit of hindsight and do not represent actual investment performance. There are limitations inherent in model performance; it does not reflect trading in actual accounts and may not reflect the impact that economic and market factors may have had on an advisor’s decision making if the advisor were managing actual client money. Model performance shown includes reinvestment of dividends and other earnings but does not reflect the deduction of investment advisory fees or other expenses.